


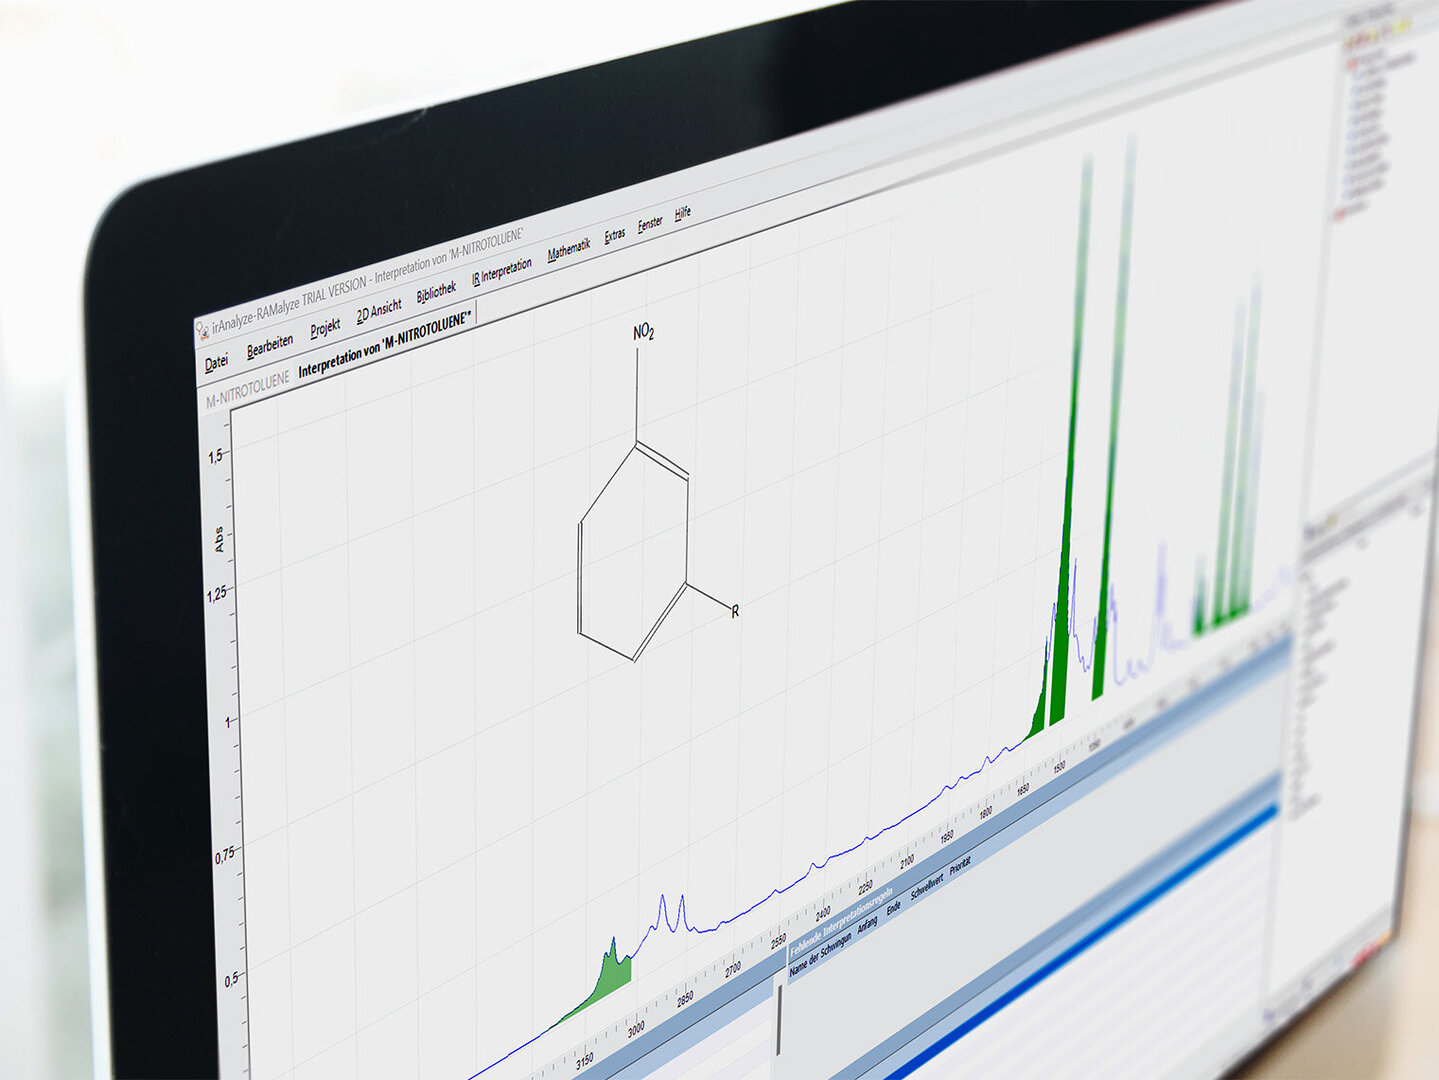
IR Interpretation with Automated Functional Group Assignment
irAnalyze spectrum reader
With irAnalyze youre just a few clicks away from getting a reliable functional group interpretation result.
Spectra
IR/NIR
and FTIR
Operating System
Windows Desktop
Application
Languages
English, German
and Japanese
Liscensing
OEM-partnership or
single use

irAnalyze
Software Overview
What is irAnalyze?
irAnalyze is an efficient tool for interpreting IR spectra, offering streamlined workflows akin to those of seasoned spectroscopists. It automatically identifies functional groups based on over 1000 interpretation rules, eliminating the need for IR atlases and books.
Areas of Use
Some areas of application include:
Research and development, Education and training, Competitor product analysis, Recycling and damage analysis, Incoming goods inspection and goods identification, Forensic analysis
Licensing Options
You can purchase the irAnalyze software either in the form of individual licenses or on the basis of an OEM partnership. Please contact us for further information.

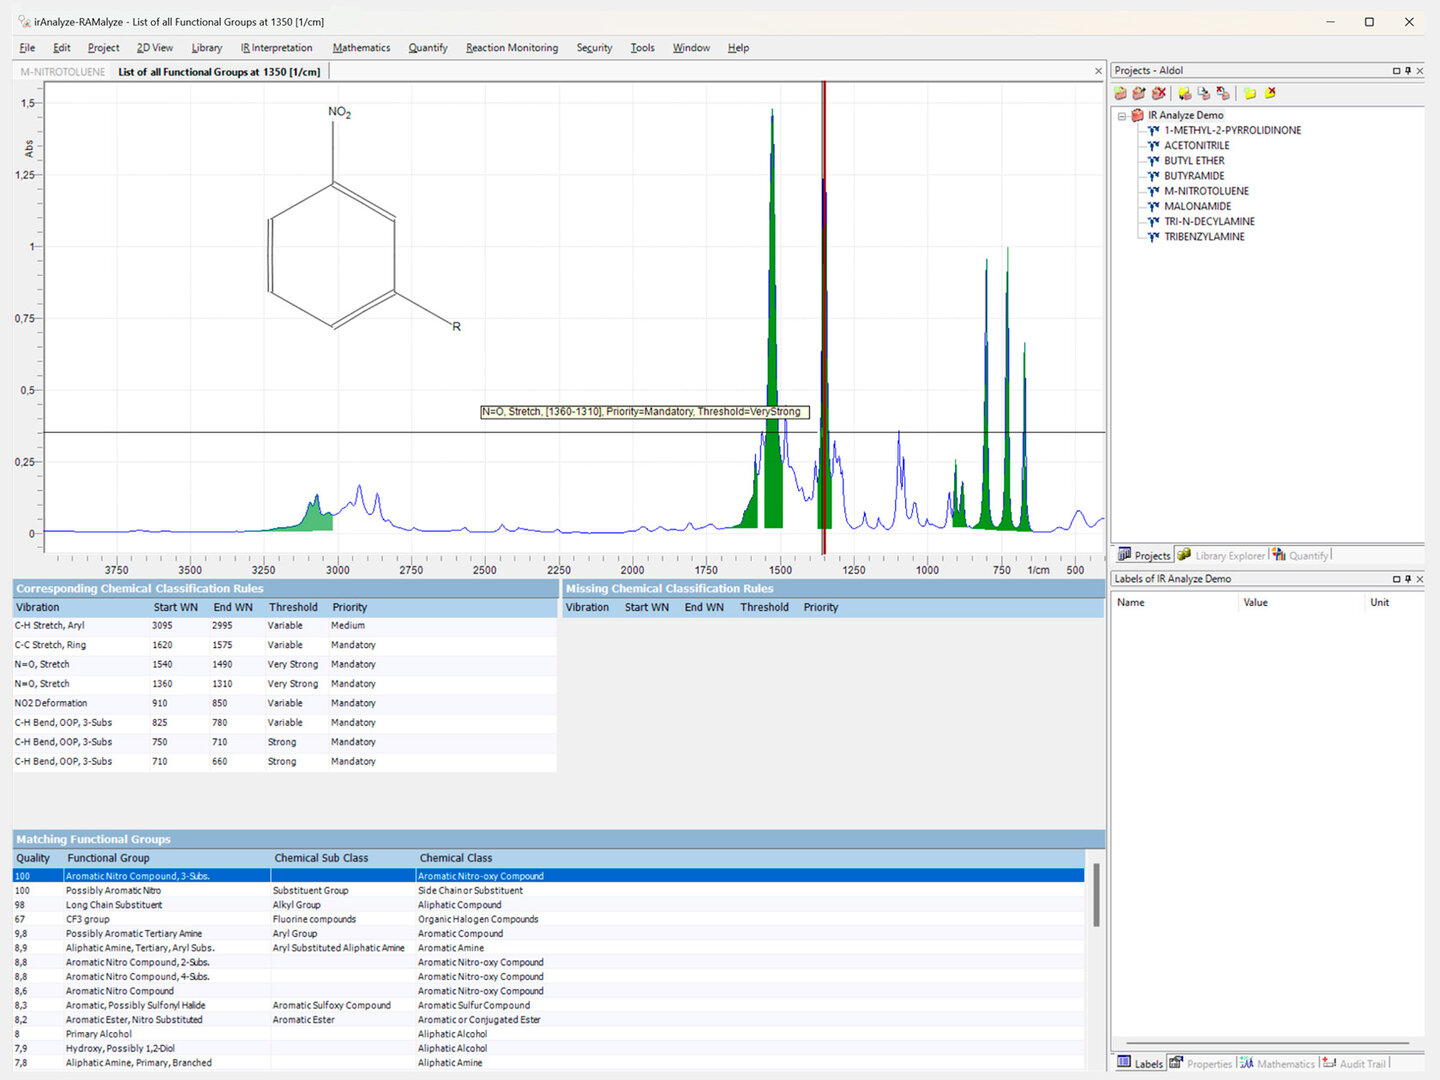
Interactive Analysis Browser
Navigate through the Spectrum
irAnalyze allows interactive interpretation as well as modification and optimisation of the results. Lower quality matches or unexpected funtcional groups can be removed from the list.
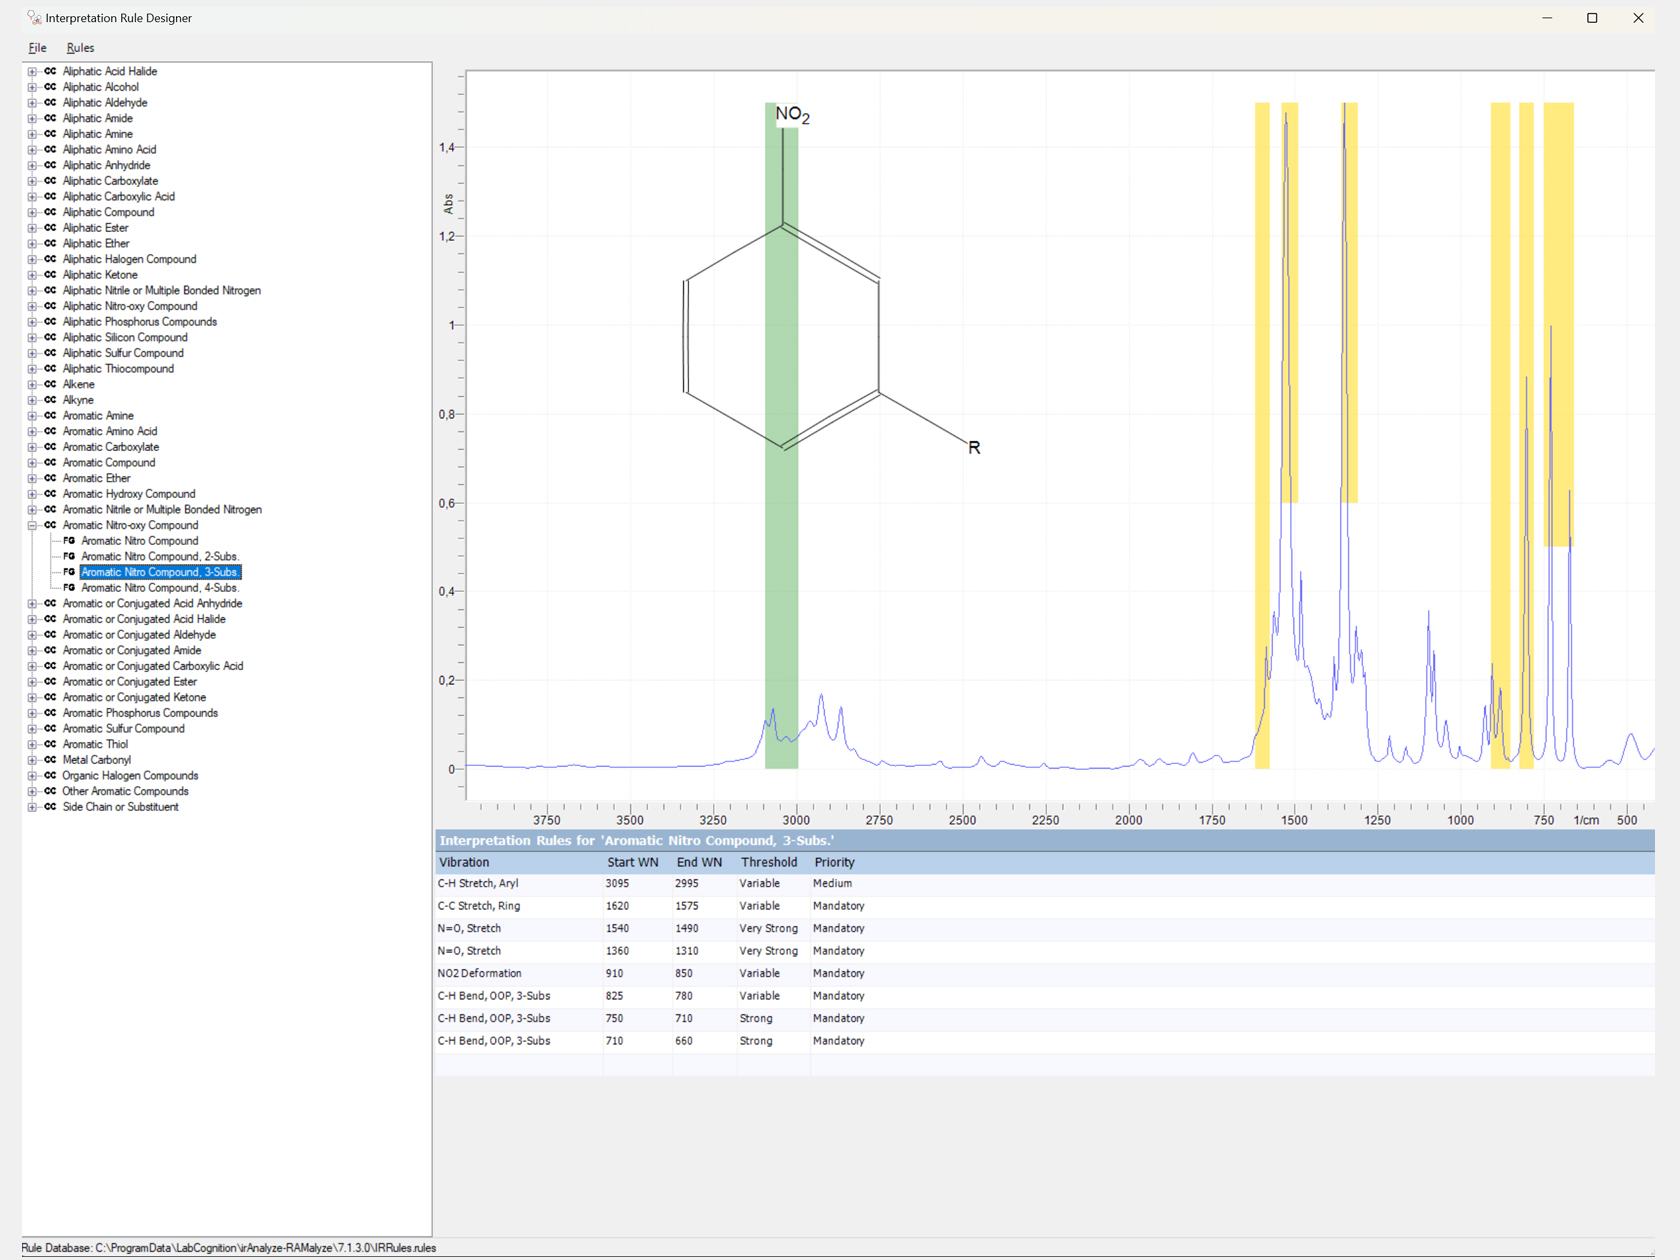
Interpretation Rule Designer
Examine Characteristic IR Frequencies
Each chemical class or sub-class contains a number of functional groups corresponding to a fragment in a molecule. These functional groups in a molecule are responsible for a collection of characteristic bands in a spectrum.

Customizable Report Template
Submit your findings
All analysis data and related information can be exported and printed immediately via ready-made templates. These templates are automatically assigned and are easy to use and customise.
Tips and Tricks
Get the Most out of irAnalyze
Increase the quality and reliability of your spectrum interpretation results by combining IR interpretation with other tools:
Ready to Dive In? Enhance Your Lab Today.
Contact us to purchase our software or to discuss project ideas and related questions. You can also experience the functionality of our software products with a no-obligation free trial.