In automatic peak detection, only peaks with a user defined
minimum intensity relative to the data baseline
and a minimum average peak width will be considered. These parameters
must be adjusted properly by the user before automatic calculation is
applied.
From the first derivative of the data object, maxima will be detected using
the Savitzky-Golay
derivative function. Shoulders and/or overlapping of adjacent peaks
might be also analyzed using the second derivative of the data object.
Some parameters can be adjusted by the user to optimize peak finding conditions.
When using manual peak finding, the user may freely define
new peaks at any data position. After adding a new peak its start, end
and maximum position can be modified.
Resulting peak information will be shown either in a peak
table or as peak markers directly in the data view or both. Display options
can be customized in the 2D
Preferences dialog. The peak
table is shown on a separate tab below the data view. It will be displayed
on demand.
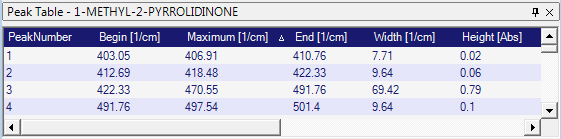
The peak table holds several columns with information regarding position
of a peak within a 2D data object. Available columns strongly depend on
the data type.
Usually, the following columns are available in a peak table:
Number
Each peak in the collection possesses a unique, concurrent number starting
from the lowest x-axis value to the highest x-axis value.
Begin
This value indicates the starting point of a peak in x-axis units.
Max
This value indicates the position of the peak maximum/minimum in x-axis
units.
End
This value indicates the ending point of a peak in x-axis units.
Width
This value indicates the difference between ending point and starting
point in x-axis units.
Height
This value indicates the relative intensity at the peak maximum in y-axis
units. The relative intensity at the peak maximum will be calculated as
difference between the absolute intensity and the baseline intensity at
the maximum.
Absolute Height
This value indicates the absolute intensity at the peak maximum in y-axis
units. The absolute intensity at the peak maximum will be calculated as
difference between the absolute intensity and zero.
Peak Area
This value indicates the peak area between the graph and the baseline,
lasting from the starting point to the ending point of a peak.
Center of Gravity
This value shows the Center of Gravity of the peak.
Visibility of peak table columns and order of appearance can be customized.
Whenever a peak table is shown in the peak
table tab customization is carried out as described in the following:
Results from Peak Evaluation are also visible
here!
If any peak evaluation methods are defined for the current data type, the
results are available in additional peak table columns. These columns
can be shown or hidden here. Please refer to the "Peak
Evaluation" section for details.
Click the Right mouse button on the peak table area.
From the dialog, select
preferred columns to be displayed.
Change their order
of appearance according to you needs.
Besides the peak table, peak markers are shown in the data view area
on top of the corresponding peak. Each peak marker consists of start,
end and maximum/minimum tick marks as well as a peak label. The peak label
shows the actual position either on the x-axis, y-axis or both. Peak markers
can be customized in the 2D
Preferences dialog.
The following excerpt from the N,N,2,4-Tetra-Methyl-Aniline
IR spectrum is submitted to peak picking in the following. The spectrum
excerpt looks like this:
Minimum peak height adjustment
The minimum peak height must be adjusted properly to give positive peak
finding results. If the value is too large, smaller peaks will not be
detected anymore. It should be adjusted close to the noise level of the
spectrum to gain optimal results.
The noise level including some minor baseline drifts up and down is
estimated to be 0.02 y-axis units. So the minimum peak height parameter
should be set to this value.
How to get the optimum peak height level?
Start with 0 as minimum peak height and minimum peak width. Then increase
the minimum peak height value in small y-axis fractions to get all the
peaks you like to see or even some more.
Minimum peak width adjustment
The peak width must be properly adjusted. If it is set too small, all
kinds of noise or spikes will be detected and false peak results will
be produced. If the value is set too large, narrow peaks might be missed
and will be kicked out of the peak list. So an average peak with for the
current data type should be entered here.
How to get the optimum peak width level?
Start with the previously adjusted minimum peak height level and enter
the width of the broadest peak in your spectrum. Adjust this value as
minimum peak width. Then decrease the value in small x-axis fractions
to slowly increase the amount of detected peaks to get as many peaks as
you like to see.
Finding peaks without adjacent peak grouping
This option is used to separate pre-selected peaks (see parameter adjustment
above) that might overlap to just one peak.
Peak finding without adjacent peak grouping is shown in the
following figure:
The following parameter settings are applied:
Group adjacent Peaks = No
Minimum Peak Height = 0.02
Minimum Peak Width = 0
All the center peaks are strongly overlapping, but the peak
grouping is deactivated for finding peaks. In this case, the baseline
strongly follows the graph slope. It moves up to the small peak in the
middle and down again. The large peak in the middle is split into a total
of three peaks.
Peak picking with adjacent peak grouping
In contrast to the figure above, the following figure shows the same
peak detection with adjacent peak grouping.
The following parameter settings are applied:
Group adjacent Peaks = Yes
Minimum Peak Height = 0.02
Minimum Peak Width = 0
The baseline does not strongly follow the graph slope in
this case. Adjacent or overlapping peaks, which do not return to the overall
spectrum baseline level, will be cut off by a vertical line. Area and
peak height calculation will be adapted to the baseline accordingly.
Peaks can be edited manually either by modification of start, end or
maximum values within the peak table or graphically. Modification of peaks
is possible as long as the Peak find tool is activated in the mathematics
tab.
Modifying peaks in the peak table
Modification of a peak within a peak table is done as described in the
following:
Browse the peak
table or just click the peak to be modified in the data view with the
Left
mouse button.
Click the Left
mouse button to enter the
field you like to change.
Enter a new
valid value.
Why is the entered value not valid?
The new entered value for start
and end of a peak must be chosen
in that way, that the peak area underneath the peak is not parted by the
graph. In other words, the baseline of the peak must not cross the graph.
The value will be adjusted automatically to the nearest valid data point
to your actually selected position.
Secondly, the position of the maximum/minimum must be within the limits
of start and end
peak marker.
Press the Return-key
to apply changes.
Graphical modification of peaks
As long as the peak find tool is activated in the mathematics tab, each
peak shows tracker icons (red squares) at start, end and maximum/minimum
position of a peak. Modification of the peak is performed as described
in the following:
Move the mouse pointer close to a tracker icon.
Press and hold the
Left
mouse button.
Move the mouse
along the graph slope to the new
destination position.
Release the Left
mouse button.
Why is my selection not applied?
The new start or end
position of a peak must be chosen in that way, that the peak area underneath
the peak is not parted by the graph. In other words, the baseline of the
peak must not cross the graph. The position will be adjusted automatically
to the nearest valid data point to your actually selected position.
Secondly, the position of the maximum/minimum must be within the limits
of start and end
peak marker.