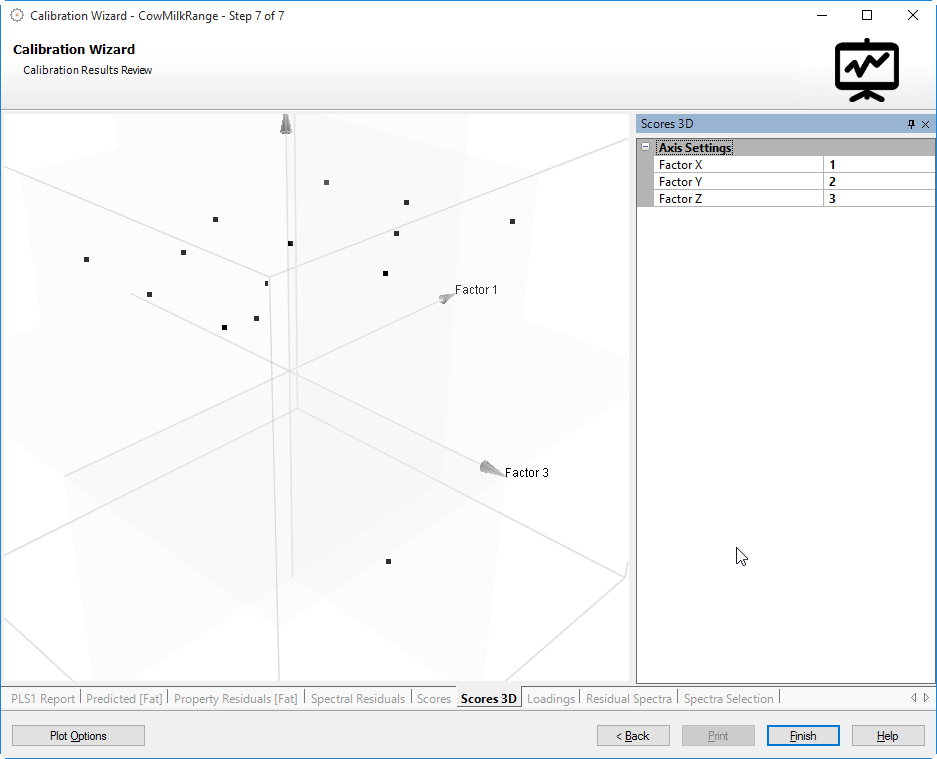
The Scores 3D plot adds a third principle component to a Scores
plot and shows relationships between samples and variation among selected
factors.
The principles for variation and similarities between samples described
for Scores plots are applicable here as
well. The 3D plot can also customized by utilizing the context menu. Simply
right-click
on the plot and make the desired adjustments.
In case of a PCA calibration
the score plot gives a convenient overview of the qualitative results
of the calibration. A good result will show all samples assigned to one
of the predefined groups ( see Calibration
Model Wizard - Step 2 ) and the groups itself will be clearly separated.
A typical Scores 3plot is shown in the following:
You have the following possibilities to customize the 3D-Graph view
in order to see all aspects of the 3D-Factor Plot:
Right-click
and hold the mouse button to move
the whole 3D-Factor Plot in the view plane.
Hold down the Shift-button and move
the mouse to zoom in and out of the 3D-Factor Plot. This can also be achieved
by using mouse wheel.
Hold down the Ctrl-button and move
the mouse to rotate the whole 3D-Factor Plot.
Perform a double-click
with the Left mouse button to restore the original scale/zoom/rotation
factor.