The auto scale to Y values option toggles the data display behavior of the 2D data view. It maximizes the displayed y-axis data range of every
spectrum in the current active data view regardless of the intensities of other spectra in the active data view. All other axes remain unchanged.
This useful to adjust the displayed y-axis data range for spectra with different y-data maximum, so that the y-data ranges of all spectra cover
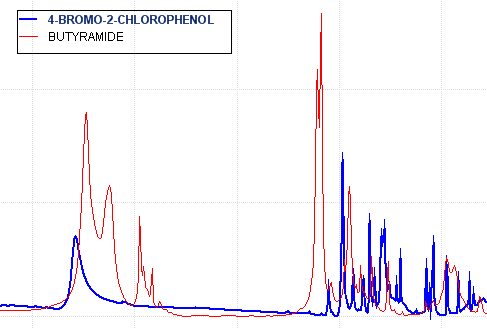
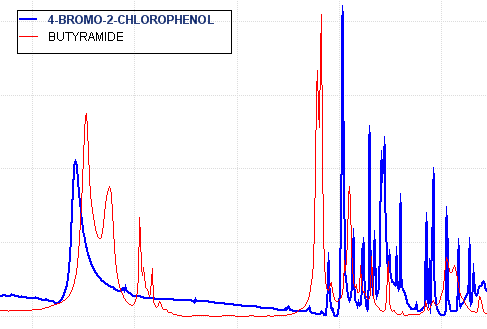
the full display area. The following two pictures show an example of the auto scale to Y values option:
Two spectra are merged into a data view. The blue spectrum has a y-data maximum of about 1, the red spectrum has a y-data maximum of about 2.
The auto scale to Y values option is turned off and therefore the blue y-data range covers only half of the display area.
The same data view with the the auto scale to Y values option turned
on. The blue y-data range is adapted to the red y-data range.
The auto scale to Y values option affects all available data objects in the current active data view. The y-axis shows the data range of the
active spectrum.