Once analytical data has been archived in a library, the user needs
to search and retrieve data according to different approaches in order
to find and receive information as quickly as possible.
The following information can be retrieved from a library:
In every day work of an analyst analytical data, especially spectra,
need to be analyzed and compared to already evaluated material. In order
to assist the analyst in his work and save analysis time or prevent wasting
time for duplicate analyses, powerful search tools are available in the
software. They quickly provide results on similar data, which have been
previously evaluated.
Depending on the data type of a spectrum, various search algorithms will be available to provide optimal search results. To
search for similar spectra in a library, please follow the steps below:
Open the spectrum
you like to search either from a file
or project.
The spectrum is displayed in the main workspace then.
From the Library
menu, select the Search Spectrum
command.
The following dialog is opened for defining search conditions
and parameters:
On top of the dialog the spectrum is shown. Parameters are listed in
the categories below.
Define search ranges
(Optional)
If you need to limit the similarity search to particular spectral regions,
you may define search ranges by clicking the New
Range button. Searching is applied only to those regions
then. (Search regions are emphasized by a green background in the figure
above). Obsolete regions can be deleted using the Delete
button.
Please refer to the Library
Search Parameter Dialog section for details.
Normalize Each
Search Range (Optional)
This option is only used, if search ranges have been defined. In this
case, intensities in each search range are scaled between 0 and 1 y-axis
units before searching.
Setup Minimum Quality
The search result provides a list with hits sorted by matching quality
values. Hits with a matching quality value below the minimum quality will
be automatically eliminated from the result. If the number of hits is
too high, please change this value to higher numbers, e.g. 80.
Select the comparing
algorithm
Depending on the data type, various comparing
algorithms are available. Please select the most reliable algorithm
for your data.
Select on or
more libraries for searching by checking
the check boxes in the Libraries to search list.
At least one library must be selected.
Select those
data labels from the list of displayed
labels in the search result table, which might contain additional information
of interest. Contents will be retrieved together with the spectrum. (Optional)
Save the search
query (Optional)
After setting up the search query, you have the opportunity to save
this query under a particular name for using it again later on.
Click the Save
button to save the search query.
Enter a meaningful name for the search query.
Your search
query is now available in the Predefined
Queries folder of the library
explorer.
Start searching
by clicking the Search
button.
Searching will take a moment depending on the number of spectra and
libraries which have been selected previously. Meanwhile a progress dialog
is shown:
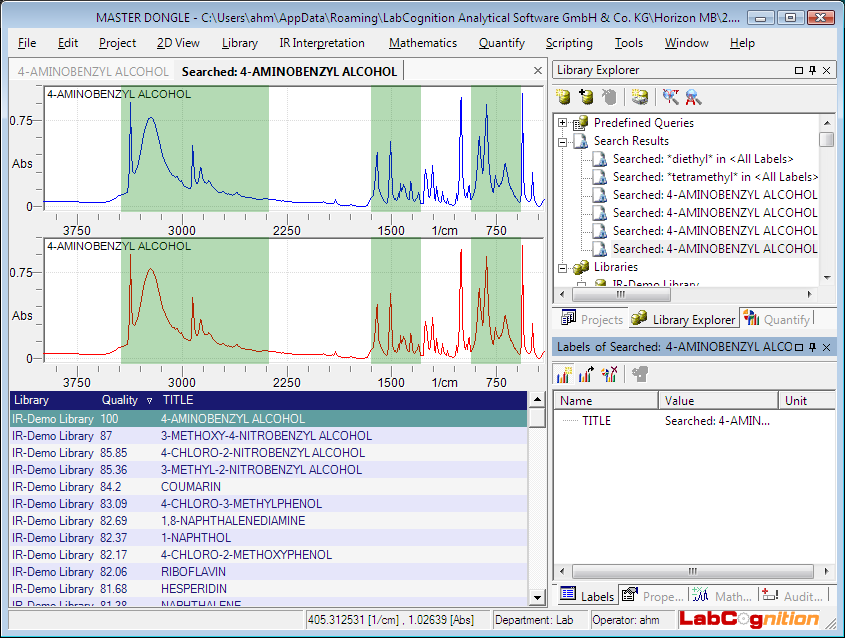
After performing a library search, either spectrum
or text
search, results are presented in a search result table as shown in
the following figure:
Additionally, the search result is stored in the Search
Results folder of the library
explorer.
Search results are stored automatically!
Whenever this search result
might be of interest later on again, it can be re-opened by double
clicking the search result node in the library explorer.
The search result shows the query spectrum
on top of the search result. The spectrum of the current
activated hit in the search result table is shown below in order
to allow direct visual comparison.
One or more hits in the search result table can be selected to see the
corresponding spectra.
Selection of a single hit is carried out by clicking
the Left
mouse button on the desired row in the search result table.
Selection of multiple hits is performed with the
SHIFT-key
or CTRL-key
held down when clicking the Left
mouse button. Selection is identical to file selection in MS-Windows
explorer.
Reset selection
by selecting a single hit in the search result table.
If many spectra have been selected in the search result table, the spectrum
view on top of the search result is quite overcrowded. In this case, spectra
can be overlaid in just one view similar to the Merge
Views function.
From the Library
menu, select the Overlay Spectra
command.
The query spectrum
(red) and all selected spectra (green, blue) of the search result table
will be merged into one view:
Reset the display
by repeating the Overlay Spectra
menu command.
Although the minimum hit quality might have been properly adjusted,
the number of hits in the search result table could be enormous. If you
are looking for a particular result, e.g. a name of a compound, you will
be able to filter the results as described in the following:
Perform a default library
search, either spectrum or text search
as described above.
The search result table is shown with many hits then.
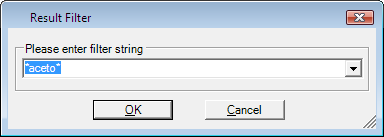
From the Library
menu, select the Apply Filter to Search
Result command.
A dialog is shown, where you can type a particular sub-string
including wild cards, which is used to filter the search result table.
Only those results, which contain the sub-string will be shown.
Examples:
*benzene: shows all results ending with 'benzene'
in any field of the search result table.
*benzene*: shows all results containing 'benzene'
anywhere in any field of the search result table.
1-Phenyl*: shows all results starting with
'1-Phenyl' in any field of the search result table.
Analysis of substance mixtures is a difficult task for the analyst or
spectroscopist. The software helps him to find suitable compounds contained
in a mixture by spectrum search on custom or commercial libraries. Once
the analyst has discovered and identified one of the substances included
by comparing the spectrum of the mixture with spectra found in a library,
further investigation of the "remaining" spectrum might be interesting.
Therefore, the software offers the Search
residual spectrum function:
Perform a default spectrum search with the mixture spectrum
as described above.
Select the most suitable compound with high quality,
which should be located somewhere on top of the search result table.
From the Library
menu, select the Search Residual Spectrum
command.
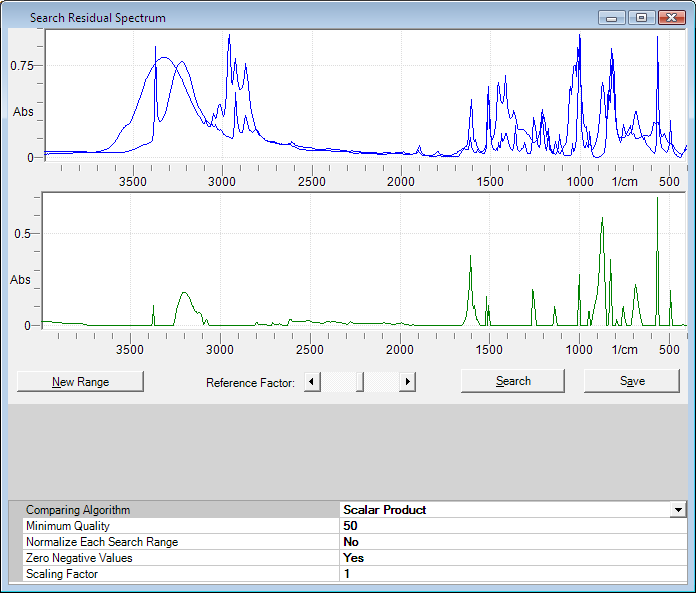
A new search Search
Residual Spectrum dialog is opened, which shows the original query
spectrum, the selected result spectrum and the residual spectrum.
The upper data view holds the original query spectrum plus the selected
search result spectrum. The lower data view shows the difference spectrum
which is going to be searched. The difference spectrum can be manipulated
by scaling the search result spectrum with the reference factor slider.
Alternatively, the reference factor can be entered into the Reference
Factor field manually. The display is updated automatically when parameters
are changed.
A second option allows to eliminate negative values. Here, all negative
values occuring after subtraction of the two spectra will be replaced
by zero.
Scale the search
result spectrum using the Reference Factor
Slider.
Alternatively, enter a reference factor into the field manually.
Setup the Zero Negative
Values flag in order to eliminate negative intensities arising
from spectrum subtraction.
Yes
Negative intensities are automatically replaced by 0.
No
Negative intensity values are kept.
Click the Search
button to repeat searching with the residual spectrum as new query spectrum.
Residual spectrum search can be performed
multiple times!
This procedure can be repeated as many times as required to identify
a number of compounds included into a substance mixture.
In many cases, analysts need to look for additional information on spectroscopic
data to find similar measurements and related data. E.g. if an analyst
needs to investigate his recently archived measurements for a particular
compound, he will search for the compound name to get all available information
on it. For such purposes, the software offers a full text search function.
Residual spectrum search can also be used
with the results of a text search!
If you want to use a residual spectrum search with the result of a text
search, simply activate the option Show
Active Spectrum in Search Result. This will display the currently
active spectrum together with the results of the text search. You may
then use the residual search described above.
From the Library
menu, select the Search Text command
or press CTRL-F
keys.
A text search query dialog is opened:
Type a suitable
search string into the Find Text
field. Wild cards are allowed.
Examples:
*benzene: shows all results ending with 'benzene' in any field of the search
result table.
*benzene*: shows all results containing 'benzene' anywhere in any field
of the search result table.
1-Phenyl*: shows all results starting with '1-Phenyl' in any field of the
search result table.
Adjust the Searched
labels settings (Optional)
Limit searching to a number of predefined labels or just search on
all labels (default).
Select on or
more libraries for searching by checking
the check boxes in the Libraries to search list.
At least one library must be selected.
Select those
data labels from the list of displayed
labels in the search result table, which might contain additional information
of interest. Contents will be retrieved together with the spectrum. (Optional)
Save the search
query (Optional)
After setting up the search query, you have the opportunity to save
this query under a particular name for using it again later on.
Click the Save
button to save the search query.
Enter a meaningful name for the search query.
Your search
query is now available in the Predefined
Queries folder of the library
explorer.
Start searching
by clicking the Search
button.
Searching will take a moment depending on the number of data and libraries
which have been selected previously.