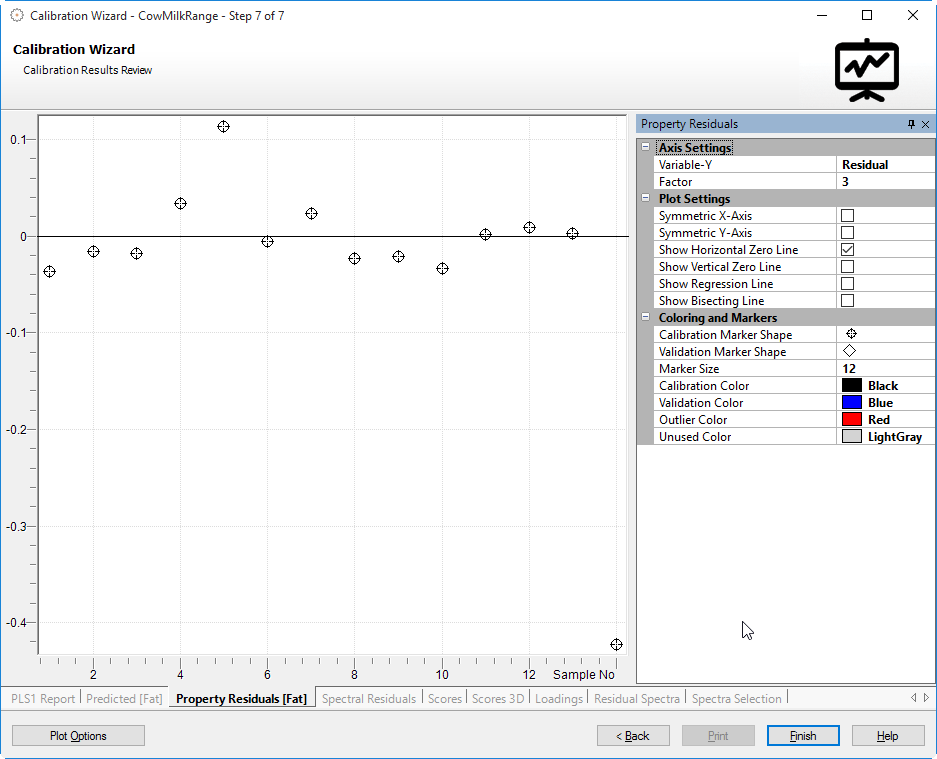
The residuals plot is the graphical display of the residual concentration
values. The plot shows the difference between the actual concentration
values and the predicted values.
This is an example residual plot:
The horizontal line at 0 marks the center of the plot. The closer the
data points are to this line, the smaller is the difference between predicted
and actual value.
Actual samples are shown as data points (crosses). Hovering the mouse
pointer over a square will show a tooltip with plot specific sample information.