Reaction Monitoring
Add-On Module
This chapter gives a short introduction to the reaction monitor add-on. This module is a powerful tool to aid the user in performing reaction monitoring, trend profiling and process analysis with spectroscopic data. The main features of the reaction monitor module are listed below:
- Online processing
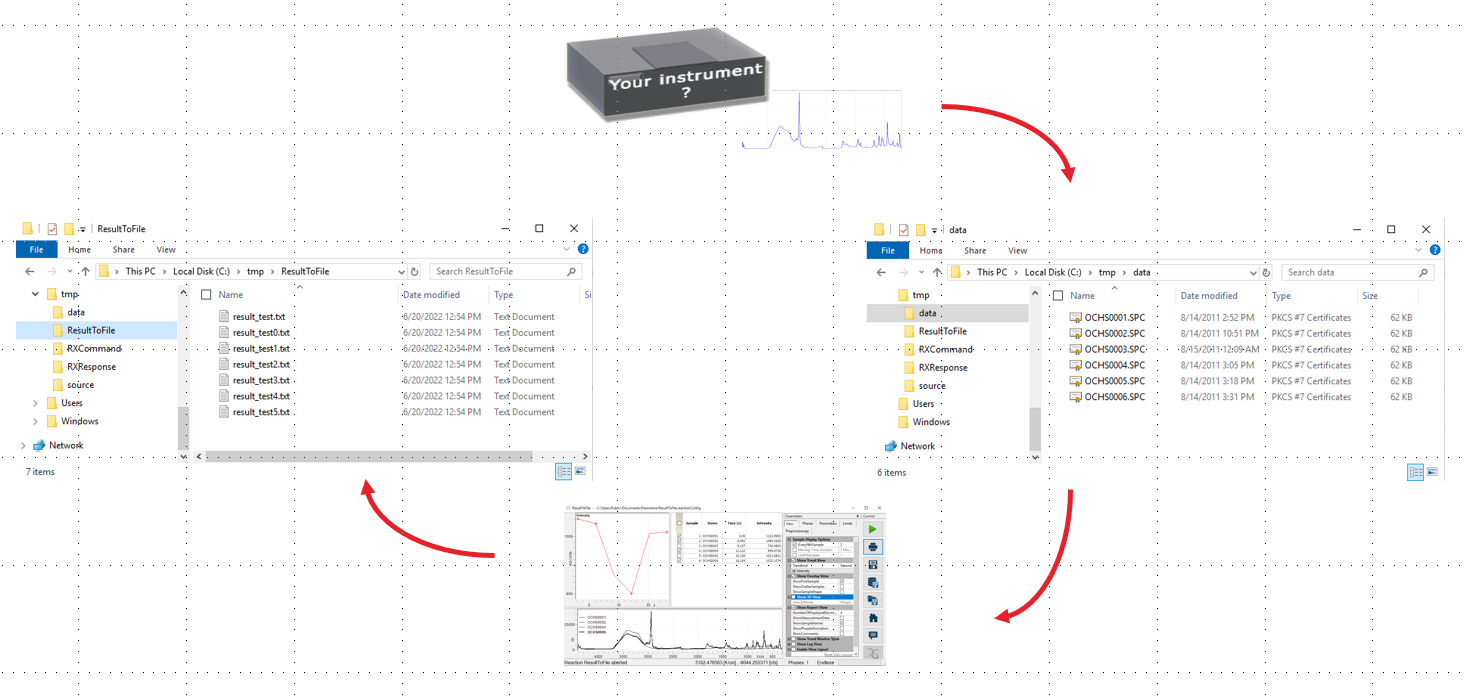
Monitor live experiments with an attached spectrometer. Multiple reaction phases with different spectrometer settings may be configured. A file system folder may be monitored as alternative data input option enabling the use of unsupported spectrometers as spectroscopic data providers. - Offline processing
Perform reaction analysis on spectra that have been recorded earlier. Rerun previously recorded reaction analyses with different parameters. - Third-party-application communication
Modbus and OPC UA Trend Consumers enable the real-time forwarding of prediction results from ongoing reaction runs to external software applications.
Designed for Laboratory and Process Development
You need to analyze a set of spectra, e.g. the kinetics of a chemical reaction or a production process? Particular peak analyses, concentrations or similar information shall be derived from all those spectra in order to obtain or monitor a trend. You like this to be done without processing each spectrum manually? Well, benefit from various trend analysis and data profiling features in our panorama Software.
The panorama Reaction Monitoring module provides you with optimal support analyzing characteristic properties and features of spectroscopic data. This means e.g. quantification but also prediction of spectroscopic trends based on your spectral 2D and 3D data.
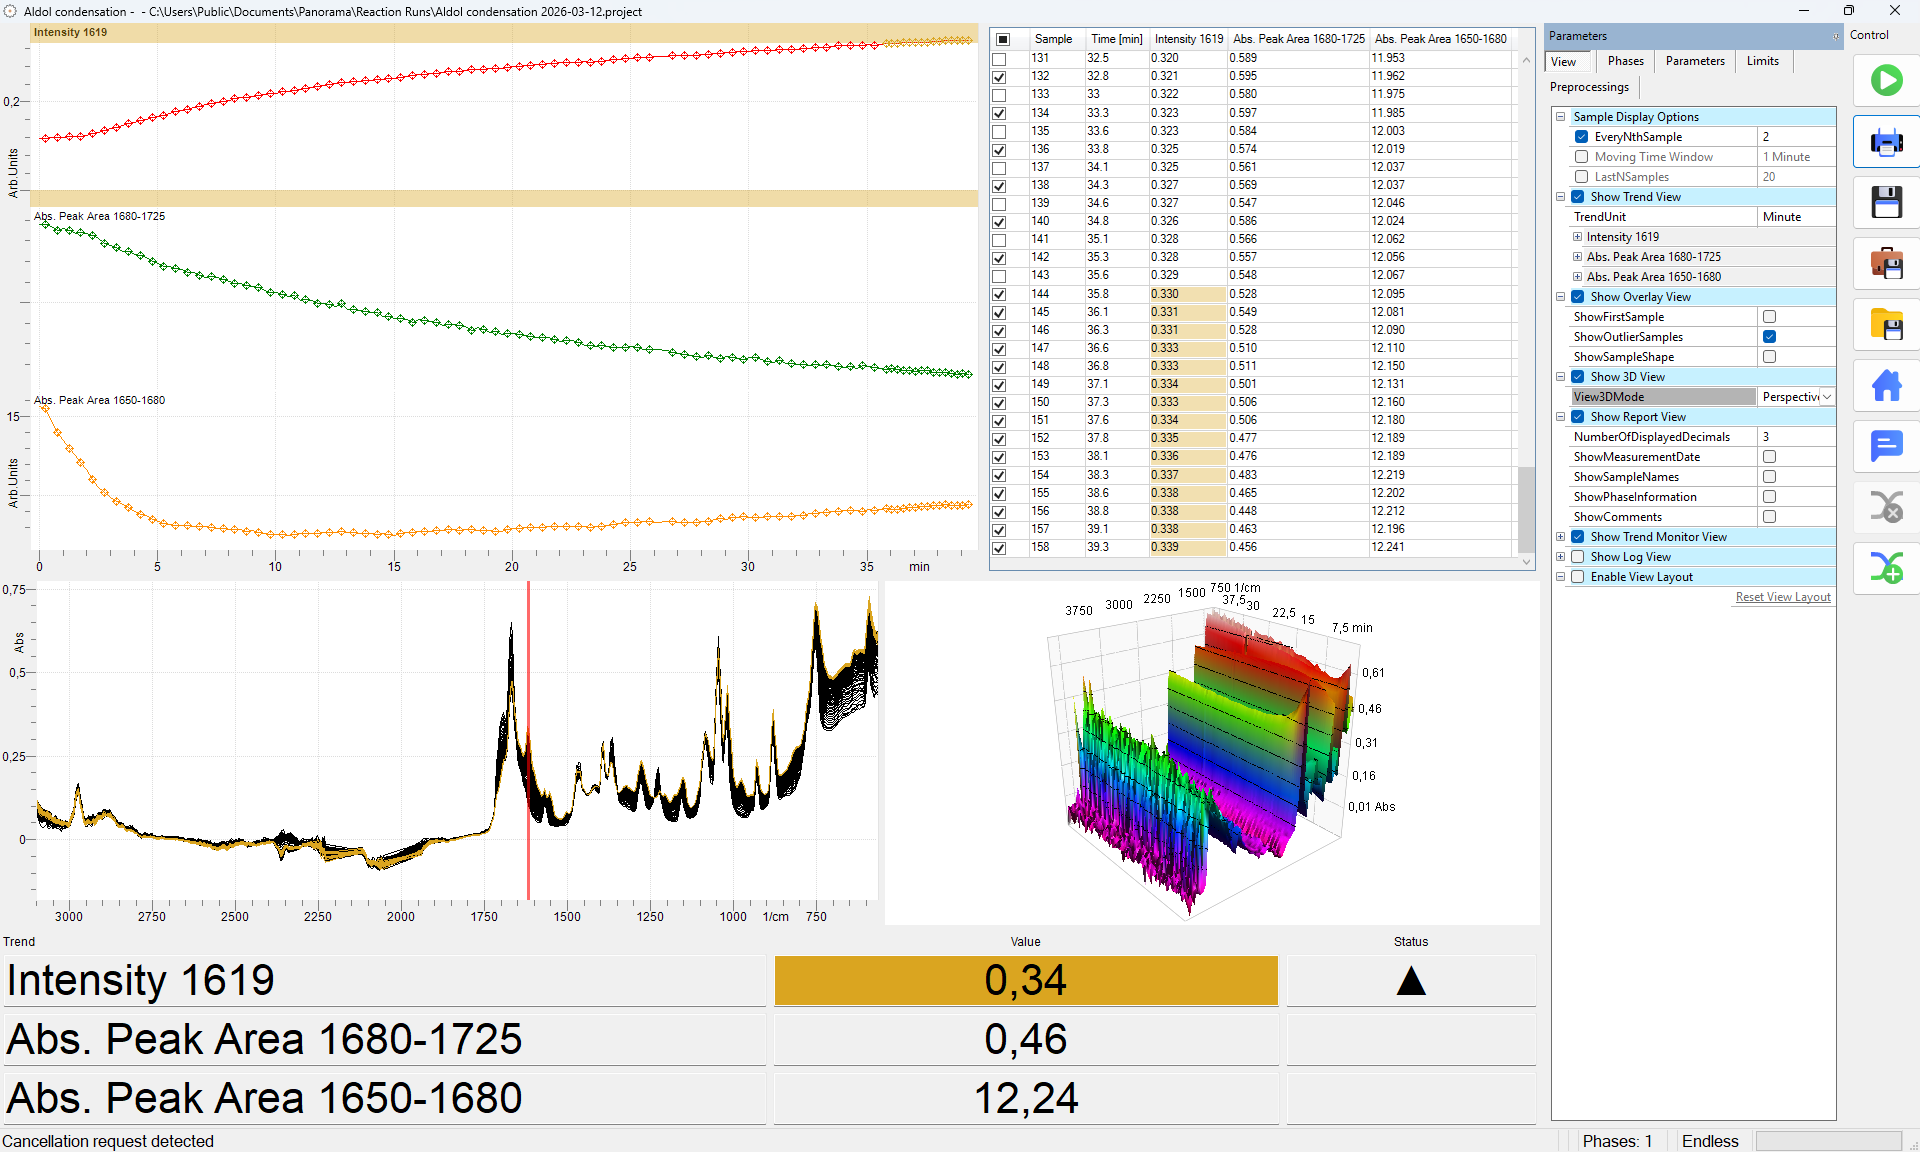
Using panorama’s RX module provides scientists a powerful tool to follow the characteristics of any chemical reaction or laboratory process for improved analytical and synthetic productivity. Acquire spectra with your spectrometer as usual while the reaction is running. Track and trend the properties of interest in real time and display results at a glance. Use profiling functions to evaluate peaks or predict properties for quantification.
View and compare multiple trend lines simultaneously and adapt trend parameters during runtime of the reaction. Even play different what-if scenarios after completion of the reaction to optimize parameters for the next run.
Features Overview
- Wizard guided reaction and trend development
- Convenient and intuitive user interface with routine and expert mode
- Interactive and real time parameter customization with trendline overlay for optimal use in evaluating different what-if scenarios
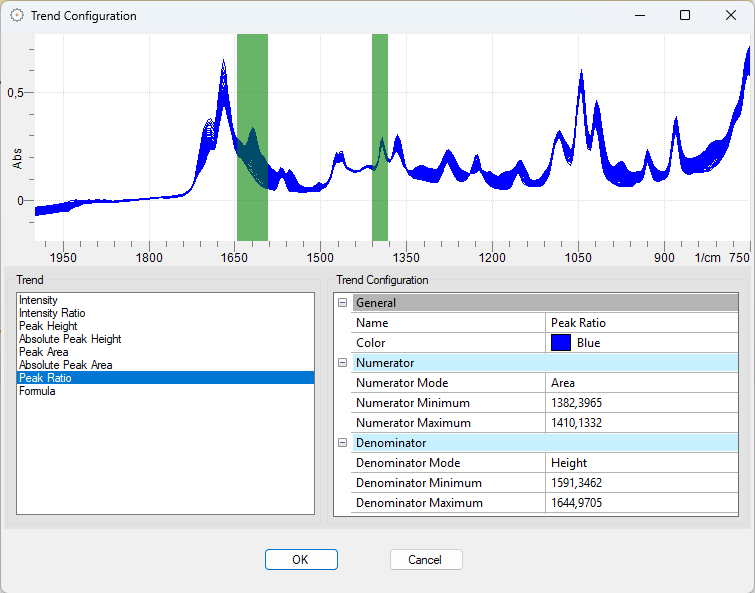
- Numerous mathematical and chemometric trend functions like:
- Signal strength
- Intensity ratio of signals
- Peak analysis like Height, absolute height, peak area etc.
- Profiling of peak ratios
- Prediction and quantification of spectral properties with multivariate methods like PLS, MLR, etc.
- Limits that have been added to a trend lets you find outliers. Such outliers are highlighted with a specific color either in the result view and in the spectra overlay too
- Spectral Preprocessing is available as an additional data evaluation / manipulation tool. Examples are baseline correction, derivative or solvent subtraction
- Comprehensive reporting of trend analysis and profiling results as text and graphics including spectral 2D and 3D data
- Display 3D data either as topdown, perspective or waterfall view
Seamless Data Forwarding with Trend Consumers
New in Version 8!
The Reaction Monitoring add-on module to the Panorama Software Family enables the continuous, real-time generation of numeric trend results throughout the course of a reaction run. These results are typically saved in a proprietary format and displayed within the main reaction monitoring panel of the respective run.
To extend this functionality beyond the native interface, Trend Consumers serve as custom add-on tools. They pick up numeric trend results — including prediction results based on chemometrics models — and forward them in real time to any third-party software application or external system of choice.
Supported Trend Consumers are:
- Modbus
The prediction results per spectrum are transferred into defined MODBUS registers. Result to register mapping and MODBUS server connection parameters can be configured. - SaveToFile (text file based; installed with Panorama by default)
The prediction results per spectrum are intended to be kept in a single line of text. Each parameter/result is separated by a configurable delimiter. Results can either be saved into a single text file which is amended on new incoming results or into separate files with a single result each. - OPC UA
The prediction results per spectrum are forwarded via OPC UA, a widely used industry standard for machine-readable data exchange between software applications. A configuration file defines the recipient's IP address and the required authorization credentials. Based on a shared data description, both parties can exchange data directly and bidirectionally once the connection is established.
Need a tailored OEM Software?
Partner with Us
Partner with us to create a customized Reaction Monitoring Module featuring your own brand identity.
In addition to its integration as an add-on to the Panorama Software, our Reaction Monitoring is also available as a fully standalone solution. For partners, we furthermore offer OEM licensing – allowing the product to be seamlessly integrated into your own portfolio, marketed under your own brand, and customized with individual branding. Feel free to reach out to us.