The report view is used to display the numerical data of the reaction
run in form of a data table. This gives the user a chronological overview
of the reaction as well as additional information about the limits, batches
and comments that have been added. It also enables the user to select
a certain range or group of samples to be displayed in the other views.
Additional data columns and other options for the view may be adjustedusing the Parameter
Panel. The view is enabled by default but can be deactivated by unchecking
the Show Report View checkbox
in the parameter panel. The report view looks like this:
Report Columns
The report view displays the reaction data in tabular form. The following
default columns will always be shown:
Selection column:
Each sample of the reaction may be selected or deselected individually.
The selection of a sample will affect the display of a data point marker
in the Trend View and the display
of the sample spectrum in the Overlay
View. For example: Selecting all samples
will display all data point markers in the trend view and all sample spectra
in the overlay view. The initial sample selection will be done automatically
according to the Every Nth sample
setting in the parameter panel / reaction
wizard (step 5). The user may select/deselect samples during or after
the reaction run using the individual checkboxes. A global selection checkbox
is located in the table header which allows the selection/deselection
of all samples at once. A complete description of all sample selection
options is given in the section Sample Selection in the chapter Operations.
Sample column:
Displays the consecutive number of the samples.
Time column:
Displays the reaction time at which the sample was measured. The unit
for the time column is defined by the Trend
Unit parameter in the parameter panel
/ reaction
wizard (step 5).
Trend column:
Displays the numerical value of the trend evaluation for each sample.
The formatting of the numerical value is selected by the parameter Number
of Displayed Decimals in the parameter
panel. The trend column will have the same name as the trend. A separate
column for each defined trend will be displayed. If a limit or golden
batch has been added to the reaction, the trend column will also be colored
according to the sample status (regular sample or outlier). This allows
for a quick visual distinction of different samples. The display color
is defined in the Limits tab
of the parameter panel.
In addition to the default columns the
user may select more columns to add extra sample information:
Measurement date column:
Displays the full measurement date for each sample.
Sample name columns:
Displays the full sample name for each measurement. The sample name
is linked to the reaction name and can be edited in the General
Parameter tab of the parameter panel.
Report Rows
Apart from the reaction data display that is defined by the Report View
Columns, additional information can be displayed by inserting special
rows into the table:
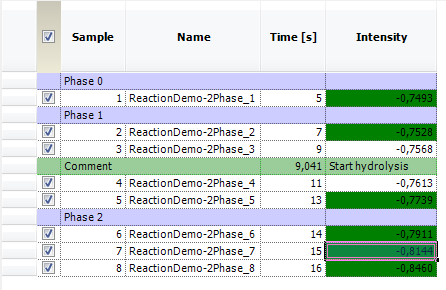
Phase information rows:
If the option Show Phase Information
is checked in parameter panel / reaction
wizard (step 5), an extra row with a different color will be inserted
for every new phase that is entered during the reaction run. This helps
to visually represent the segmentation of the reaction data into phases.
Show comments rows:
If the option Show comments
is checked in parameter panel / reaction
wizard (step 5), an extra row with a different color will be inserted
for every new comment that is added to the reaction. The comment will
also be shown as vertical bar in the trend view. A detailed description
of how to add comments to a reaction is given in the chapter Add/Remove Comments.