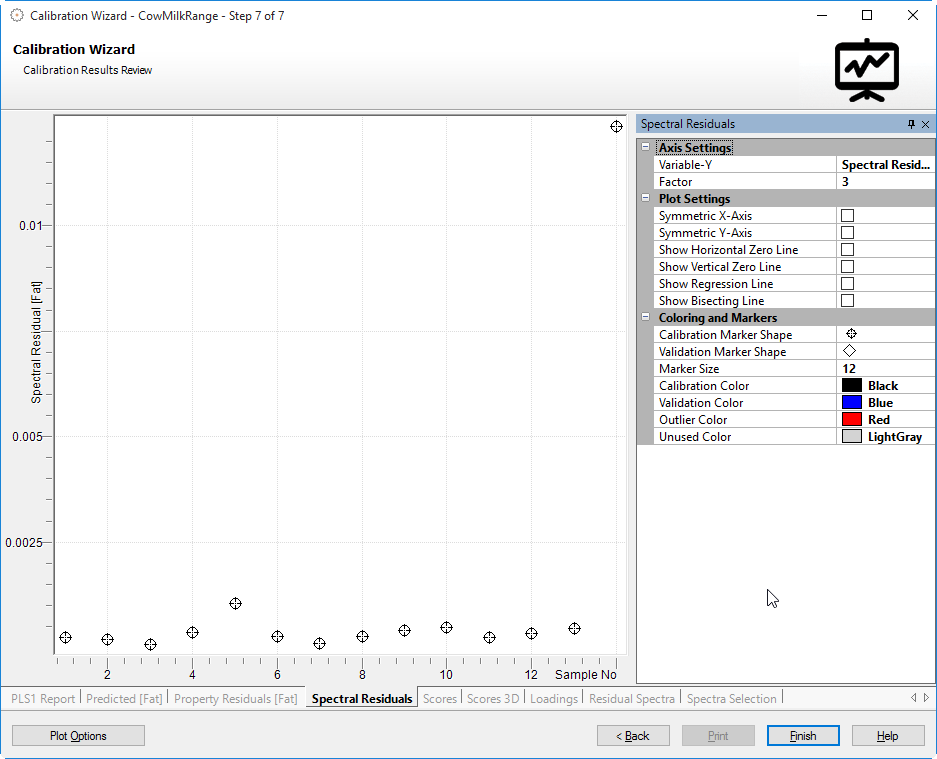
The spectral residuals plot is the graphical display of the spectral residual values.
This is an example residual plot:
Actual samples are shown with the selected marker shape. Hovering the mouse pointer over a square will show a tooltip with plot specific information.