For advanced users dealing with spectral information, they like to see
any 2D data as numbers too. This
function is useful to allow some calculations by hand or copy spectral
data to other applications. The 2D data view
can be simply toggled
to show data either as graph or in a data table. Respective commands are
described in the Show Data
in Table command section.
The data table can be copied into the clipboard!
The default table functions of the software also apply to this data
table. For details, please refer to the Working
with Tables section.
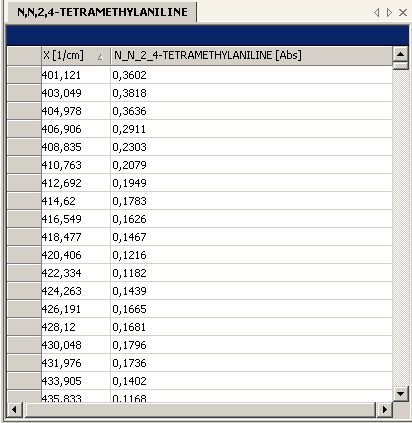
A default data table for a 2D data object looks like this:
For convenience only the active zoom region of a graph view is taken
into account when toggling to the data table. In this case, only data
points of the zoomed region are shown in the data table. This allows users
to extract exactly what they need from a vast amount of numbers.
To see all available data points in a table, one must perform an Auto scale command in advance.
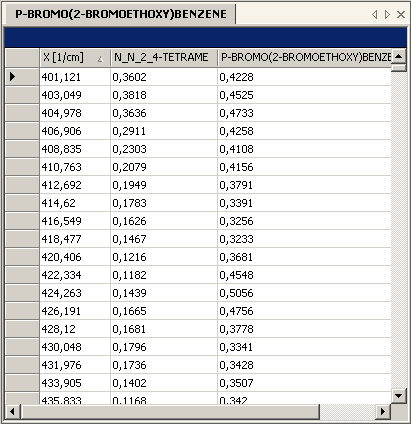
If several 2D data objects have been merged into a data view, they can
be shown in a table as well. Besides the x-axis column, for each 2D
data object a separate data column is available in the table. The
column header shows the name of the data object.
Some table fields contain (null) value!
If data with different resolution or number of data points are merged,
they can of course be shown together. In the data table view, some data
points might not be available for one particular 2D data object where
they are for another. In this case empty fields appear being filled with
the (null) value.
Start the target application and paste the clipboard contents.
Copy the whole data table
Click into the grey field in the top left corner of
the data table with the Left
mouse button.
From the Edit menu,
select Copy Full Data Table.
Start the target application and paste the clipboard contents.
Some contents cannot be copied!
Some data might be copy protected, e.g. commercial spectral libraries.
In order to protect the owners copyrights some contents are not allowed
to be copied.