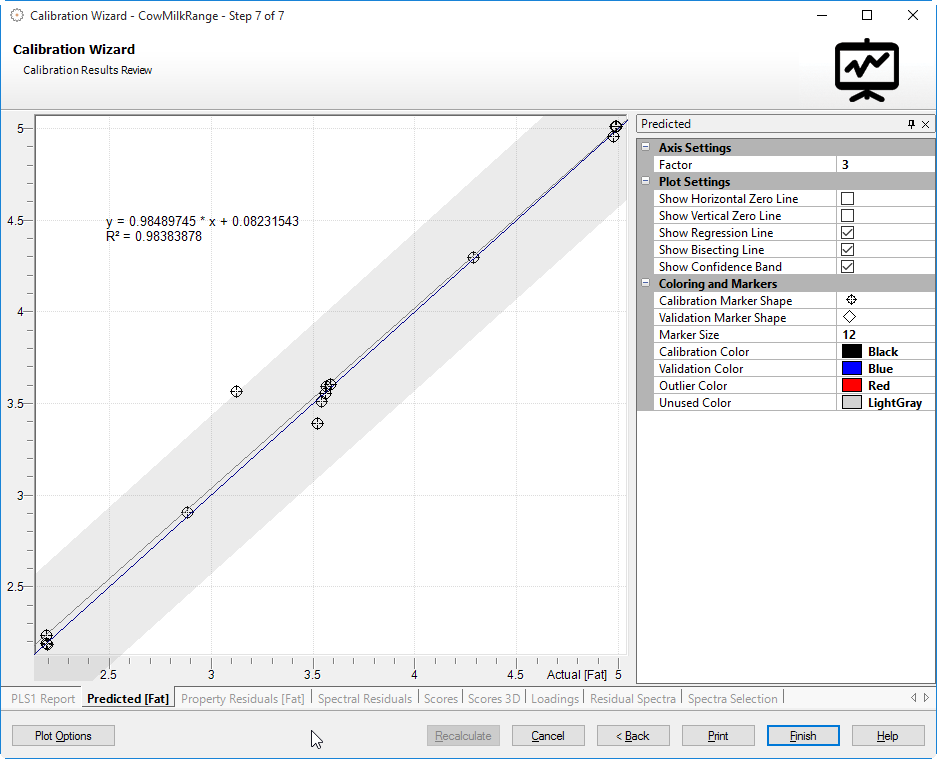
The Regression plot is only available in the univariate calibration.
It simply plots the constituent property value against the evaluation
parameter. This gives the user a quick overview how well the chosen evaluation
parameter correlates with the property value. An optimal correlation would
show all data points on a straight diagonal line.
The regression parameters can be adjusted by using the regression settings
window on the right side of the tab: