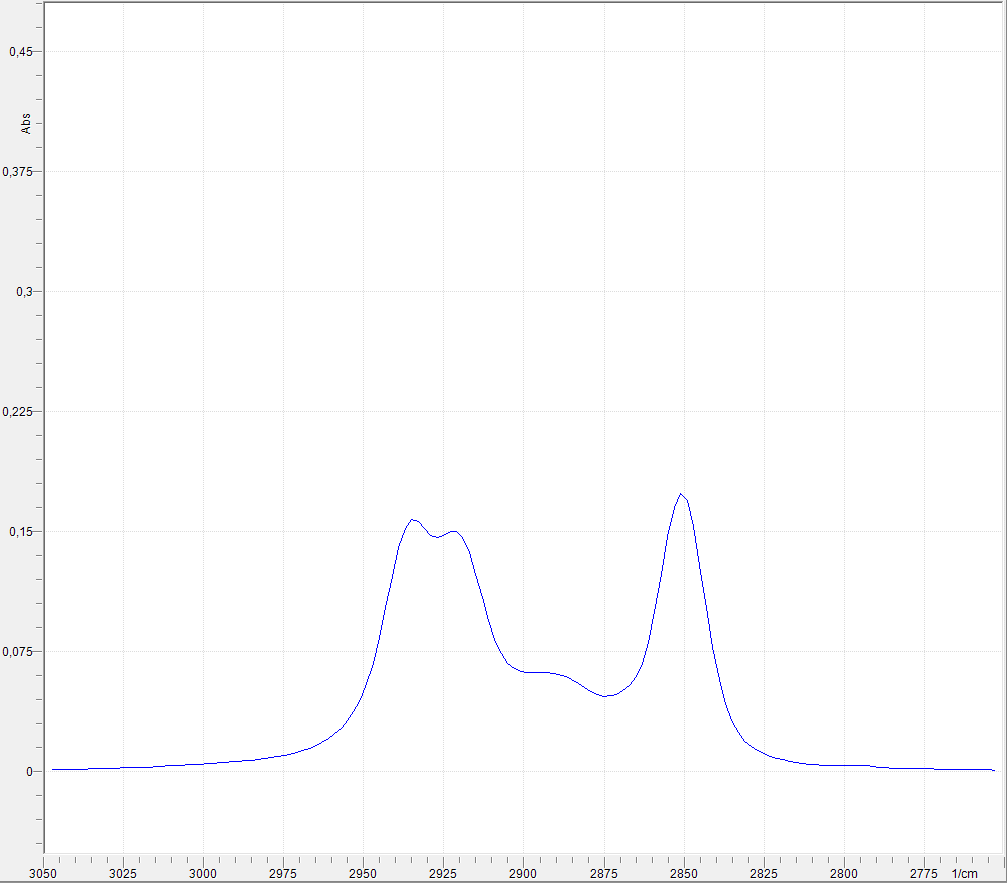
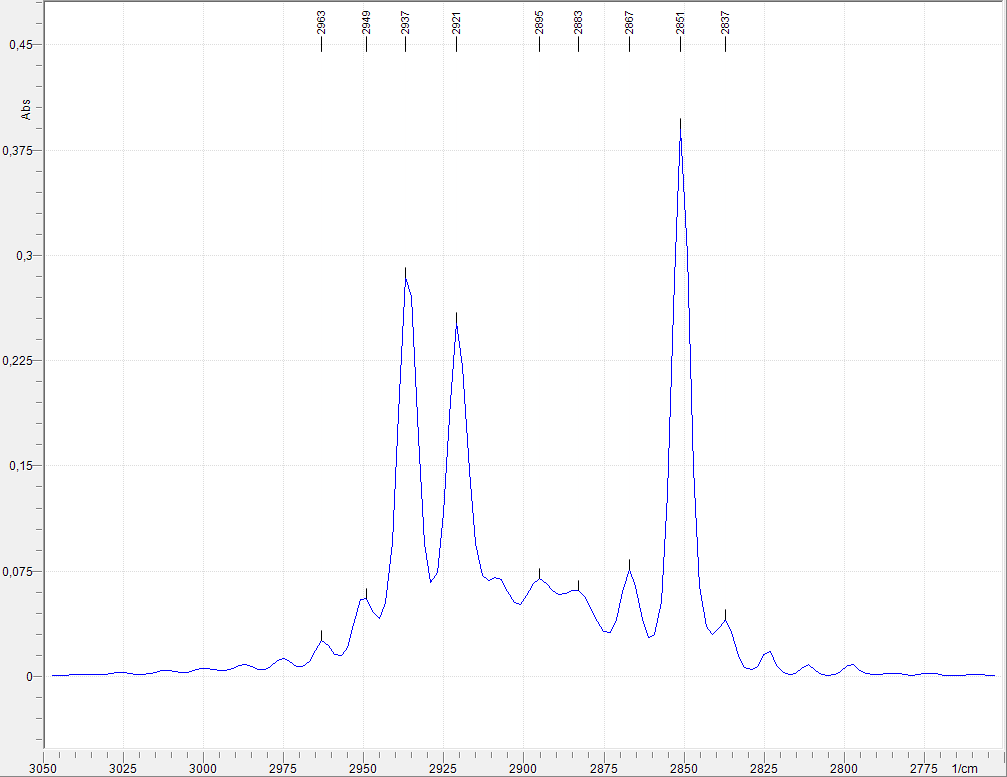
Deconvolution is applied to one or more 2D spectral data objects and will produce a new spectrum having peaks better resolved accordingly. The algorithm is used to separate overlapping peaks from each other in order to yield a better peak baseline and hence allow more reliable peak area calculation. The peak shape of each peak is assumed to be some ideal peak shape of a Gauss, Cauchy-Lorentz or linear combination of both functions. Based on numerical operations the peak shapes are automatically fit throughout all available peaks in the spectrum.
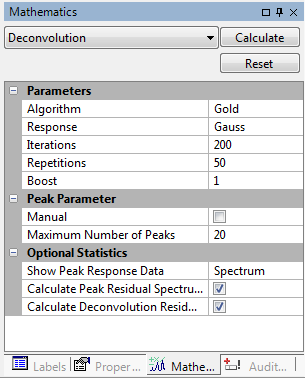
The following options are available for the
transformation:
Algorithm
Specifies the numeric calculation algorithm for the deconvolution being well described in literature:
Gold
Richard-Lucy
Response
The response curve sets the ideal peak shape function used for peak fitting. This can be one of the following functions:
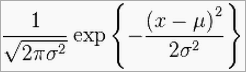
Gauss
The formula of the Gaussian normal distribution function is given below:
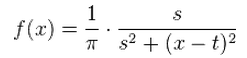
Cauchy-Lorentz
The formula of the Cauchy-Lorentz normal distribution function is given below:
Voigt
The Voigt profile is a linear combination of Gauss and Cauchy-Lorentz.
Iterations
Controls how many iterations the algorithm shall do. The higher the combination of Iterations and Repetitions (see below) the better the result.
Iterations and repetitions
Be careful setting up these parameters, because calculation time increases with increasing number of iterations and repetitions.
Repetitions
Controls how many repetitions the algorithm shall do. Repetitions multiplied with Iterations shall not exceed 10000. Otherwise
calculation may take too long and the result won't be better.
Boost
Sets whether the result spectrum shall be boosted. 1 = 100% no change. Values less than 1 result in lowering, higher than 1 in boosting.
Manual
This parameter controls the algorithm's auto- or manual detection of the average full width at half maximum value of available peaks. The shape of the response curve is adjusted to match the average peak's full width half maximum value.
Checked: Activate manual selection of the Full Width Half Maximum value used for the response curve calculation.
Unchecked: A Full Width Half Maximum value will be automatically calculated based on the loaded spectrum.
Maximum number of Peaks
Defines how many Peaks should be taken for preview, descending from the strongest.
Calculate Convolution Residual
Calculates a residual spectrum by subtracting the deconvolved result spectrum and the original spectrum.
Calculate Peak Response
Calculates a simulated spectrum as an overlay of ideal peaks based on the actual full width half maximum value. No peaks : No Spectrum shown Spectrum: Show the Peak Response as one Spectrum Individual: Show the Peak Response as multiple Spectra based on every Peak for itself
Calculate Peak Residual
Calculates a residual spectrum by subtracting the simulated peak spectrum and the original spectrum.
References
"Advanced Spectra Processing" Miroslav Morhac, Institute of Physics, Slovak Academy of Sciences, Dubravska cesta 9, 842 29 Bratislava, Slovakia, Digital Signal Processing 13 (2003) 144–171.